Thursday, 5 September 2013

MARKET SALUTES RAGHURAM RAJAN WITH 150 POINT STELLAR RALLY

Todays gap up of 150 point on Raghuram Rajan speech is a good thing for everyone. The bulls get their profit booking zones and shorts can be back with a risk-reward in favor.

Technically the trend has changed to down post the trendline breakdown. A retest of same is always warranted and generally is a good time to increase cash or go short.

This is the quick technical chart.

NiftyTrendChange thumb Nifty – A 150 point salute to Raghuram Rajan


Wednesday, 4 September 2013

Bhushan Steel IS THERE SOMETHING FISHY

bhushansteel thumb Bhushan Steel – Surprising Data – Low Delivery Volumes but Range Bound Prices!!

-> Bhushan Steel was a darling stock of traders in 2006 and 2009 moves but over the last 1-2 years the stock has gone nowhere.
-> At the same time other stocks in the same sector have collapsed or seen wild moves the stock is holding fort at 450 for almost 12-18 months.
-> Now surprising facts

Delivery volumes are only 5%. Implies 95% of the trades are intra day !!
For a stock worth 10k crores or almost 2 billion dollars the traded value is only 1-2 crores.
A stock which has performed superbly well for last few years ( from 50 in 2009 to 450 now ) there is no mutual fund holding the stock.
Promoters and other entities hold around 80% of the shareholding.
Technically the chart seems to be pretty controlled as no effect of falling or rising indices or peer group companies.
The biggest concern is the fact a stock which is not in the limelight and seeing no price moves has 95% of the trades to be intra day. There is something fishy.

Finally there is only one Fund which believes in the company – LIC.
LIC has bought a good 2.7% stake into the stock as per the last shareholding pattern.(IS FEEL SOMETHING FISHY HERE)

This will be an interesting stock over next few quarters. Mind you technically its a big avoid and if you hold it then book profits.

ONGC , Tata Global – 2 STOCKS AT GOOD SUPPORTS

First to start with given that Nifty trendline has been broken and any rise to 5500-5650 will continue to face resistance it is difficult to take fresh long trades unless its one with good price/volumes and momentum breakout on upside.

But if one does want to do bottom fishing than couple of stocks which come on the technical radar are.


ONGC


ongc thumb ONGC , Tata Global – Two stocks at support lines.


-> Over the last 3 years the stock has been holding on to the support band of 240-250 on the lower side.
-> Earlier we did see a breakout above 300 which gave a smart move but failed to go beyond 350-360 band.
-> One can keep a stoploss of 235 for this trade on a closing basis.

TATA GLOBAL 

tataglobal thumb ONGC , Tata Global – Two stocks at support lines.

-> There is a strong trendline support around 135-140 band.
-> Till it holds 132 one can expect a bounce towards 150-160.

Monday, 2 September 2013

Nifty at Support or Resistance?

Here’s what weekly chart tells us

What does long tail at 200 week moving average signify? – SUPPORT

Contrary to popular perception – Nifty has been in steady uptrend since January 2012 post bottom formation around 4600. 
The Jan-Feb 2012 Rally (AB): In just 7 weeks in Jan-Feb 2012 – Nifty rallied from 4600 to 5600. It was a quick 21% rally.
Corrective Pullback (BC): The quick euphoria waned and Nifty lost its way and declined from 5600 to 200 week ma by end May 2012.
Took Support and Rallied (DE): Nifty took the support at 200 week ma and rallied again from 4800 all the way to 6200 between June 2012 and May 2013. That was an impressive rally of 29% in a year.
Corrective Pullback from 6200 (E): Nifty once again started correcting and in just 3 months – came down from 6200 to 5500 by August 16 2013. The level of 5500 had acted as support in 2013 and hence there was nothing out of place and too bearish. 
The Period of CONFUSION: Last Two weeks
The period of confusion has come in last two weeks when Nifty dramatically broke down below 5500. Post Breakdown – there was sharp sell off and equally sharp pullback resulting in two long legged doji formation.  Doji represent anxiety, confusion and indecisiveness. Technically, on a weekly chart – the print represents indecisiveness above 200 week ma with two massive short covering from lows. 
The Big question: Has market sold off enough at large cap level to stage a comeback? 
On a weekly chart, the answer can be “may be” but if you scratch the surface, scan the fundamentals and look ahead – there is no case to buy the market. The level of 5500 looks like a tough resistance for Nifty to cross and not support.

CAN PIPAV RECOVER FROM 50- 52


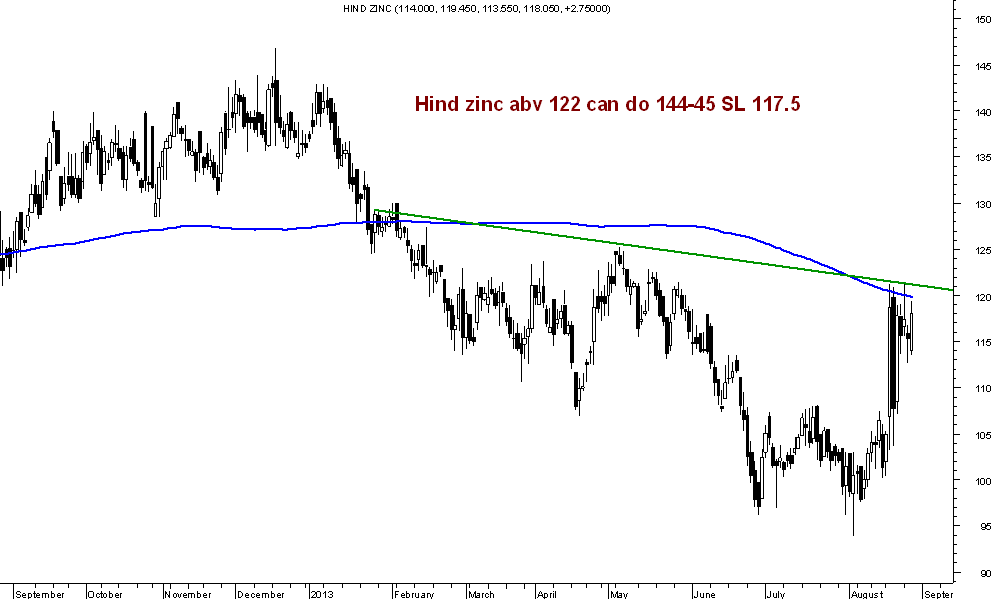
BREAK OUT STOCK :HINDZINC

FRESH BREAK OUT STOCK BUY HIND ZINC ABOVE 122 SL 117.50 TARGET 140-145