Wednesday, 10 July 2013

RECENT EVENTS AND THE MARKETS


Subsequent to the confirmation by the US Fed that Tapering of Asset Purchases is going to be a reality now we saw the markets sell of sharply. Even prior to the event I had written in my last article that we should not fear FED Tapering but welcome it. The main logic’s being that firstly it will happen if the US Fed believes that the economy in the US is now on a self sustaining upmove and secondly because a strong USD traditionally has been negative for commodities and as such the inflation driven by high commodity prices should moderate. Lower to stable commodity prices will ultimately be also positive for a country like India as it will substantially reduce India’s CAD over the long term.As I had written earlier, only traders need to be worried about the Tapering and that is what transpired. Markets sold off post the tapering announcement before regaining all the losses over the last few trading sessions.However the other big side affect post FED announcement has been the sell off in most currencies versus the USD. This has been even more prominent for emerging market currencies, especially those which have a high CAD. As such we have seen that the INR has fallen by nearly 12% over the last two months, first in anticipation of the Tapering and then after the actual event. The fall has got accelerated due to the sell off in Indian Bonds which has bought to light the deficiencies in the short term policies of the RBI and the Government of India which did not use the extremely low yields and strong market liquidity right from third quarter of last year to the first quarter of 2013 for raising a Sovereign Bond. They made the entry of more and more short term FII flows into Government bonds easier and easier. As we have always seen that short term fixes have adverse affects and as a result we have already seen a nearly $ 8 billion flow out of Indian Government Bonds. If the same money had been raised via a sovereign bond issue at a yield of just around 3.5% (when the US 10 year was trading at 1.5%) we would have been much better off. The Forex reserves would have moved up sustain-ably and the country would have locked in long term USD money at cheap borrowing levels. The bond sell off by FII’s in the domestic market would not have transpired and as a result the sell off in the INR would also have been much more moderate. Today US 10 yr bonds yield 2.7%, just 0.8% below what India could have borrowed at just 3-6 months back.Subsequently we had a few days where some of the usual suspects created a flutter in the market and the markets sold off on some political issues in Portugal and also some issues that the Trioka of lenders were facing with Greece. However as we have seen not several but tens of time in the past such issues normally create volatility but cannot change the trend. As such these fears have turned out to be just that and in my view will remain the same in the future too.The one big change that came out of the policy meeting of the European Central Bank was that they gave a long term direction which they normally never do. Subsequent comments of ECB officials have also been quite dovish and this combined with the extremely dovish stance of the Bank of Japan today creates a situation where the long term direction of the USD seems to be turning up and in a strong manner. This move now has implications in terms of creating a weakness in other currencies versus the USD. However the one key difference in thought between the arm chair economists and reality is that currencies will follow the direction of economic growth outlook and not interest rates. Raising interest rates in order to strengthen the currency or keeping rates high is the traditional thought process. However it is only a short term fix. The longer term fix for the currency is to improve the growth prospects. There is no shortage of liquidity in the world and despite the panic created around FED Tapering there is unlikely to be a global liquidity shortage anytime over the next three years atleast. The reasons are simple to understand.-The FED is going to Taper purchases, not sell assets in the markets. As such additional liquidity is still getting generated.-Money printing by the BOJ just started six months back and will go on for atleast two more years-The ECB has indicated very low rates for the foreseeable future. This will also keep Euro liquidity strong.The important thing then is to create an opportunity for this liquidity to get gainfully deployed in your economy. For this the government needs to revive the investment cycle and boost foreign investor confidence. There are some indications that the governemtn wants to move in this direction, however given that they have spend four years going the other way it will still take some more time. The worst impact of the weak currency is that it increases inflation without an increased demand. We have already had two major depreciation cycles in the last three years. We clearly need the currency to stabilize if growth has to revive. However responses like reducing bank trading positions, increasing margins, making foreign borrowings easier are just short term fixes and that is what the government and regulators are doing right now.Interesting Chart formationsOver the last couple of years I have tracked the bonds and markets of Spain and Italy as two markets that have given lead indicators for other markets. Easing bond yields and reduction in fear in the bonds of these two countries has been positive for equity markets. Lately I have observed interesting chart patterns in the equity markets of both these countries. These mirror the way the markets were before the big bull phase started in the year 2004. Sometimes historical patterns do repeat as we saw in the case of gold. Lets see how it plays out for the equity markets. Subsequent to the confirmation by the US Fed that Tapering of Asset Purchases is going to be a reality now we saw the markets sell of sharply. Even prior to the event I had written in my last article that we should not fear FED Tapering but welcome it. The main logics being that firstly it will happen if the US Fed believes that the economy in the US is now on a self sustaining upmove and secondly because a strong USD traditionally has been negative for commodities and as such the inflation driven by high commodity prices should moderate. Lower to stable commodity prices will ultimately be also positive for a country like India as it will substantially reduce India’s CAD over the long term.As I had written earlier, only traders need to be worried about the Tapering and that is what transpired. Markets sold off post the tapering announcement before regaining all the losses over the last few trading sessions.However the other big side affect post FED announcement has been the sell off in most currencies versus the USD. This has been even more prominent for emerging market currencies, especially those which have a high CAD. As such we have seen that the INR has fallen by nearly 12% over the last two months, first in anticipation of the Tapering and then after the actual event. The fall has got accelerated due to the sell off in Indian Bonds which has bought to light the defeciencies in the short term policies of the RBI and the Government of India which did not use the extremely low yields and strong market liquidity right from third quarter of last year to the first quarter of 2013 for raising a Sovereign Bond. They made the entry of more and more short term FII flows into Government bonds easier and easier. As we have always seen that short term fixes have adverse affects and as a result we have already seen a nearly $ 8 billion flow out of Indian Government Bonds. If the same money had been raised via a sovereign bond issue at a yield of just around 3.5% (when the US 10 year was trading at 1.5%) we would have been much better off. The Forex reserves would have moved up sustainably and the country would have locked in long term USD money at cheap borrowing levels. The bond sell off by FII’s in the domestic market would not have transpired and as a result the sell off in the INR would also have been much more moderate. Today US 10 yr bonds yield 2.7%, just 0.8% below what India could have borrowed at just 3-6 months back.Subsequently we had a few days where some of the usual suspects created a flutter in the market and the markets sold off on some political issues in Portugal and also some issues that the Trioka of lenders were facing with Greece. However as we have seen not several but tens of time in the past such issues normally create volatility but cannot change the trend. As such these fears have turned out to be just that and in my view will remain the same in the future too.The one big change that came out of the policy meeting of the European Central Bank was that they gave a long term direction which they normally never do. Subsequent comments of ECB officials have also been quite dovish and this combined with the extremely dovish stance of the Bank of Japan today creates a situation where the long term direction of the USD seems to be turning up and in a strong manner. This move now has implications in terms of creating a weakness in other currencies versus the USD. However the one key difference in thought between the arm chair economists and reality is that currencies will follow the direction of economic growth outlook and not interest rates. Raising interest rates in order to strengthen the currency or keeping rates high is the traditional thought process. However it is only a short term fix. The longer term fix for the currency is to improve the growth prospects. There is no shortage of liquidity in the world and despite the panic created around FED Tapering there is unlikely to be a global liquidity shortage anytime over the next three years atleast. The reasons are simple to understand.-The FED is going to Taper purchases, not sell assets in the markets. As such additional liquidity is still getting generated.-Money printing by the BOJ just started six months back and will go on for atleast two more years-The ECB has indicated very low rates for the foreseeable future. This will also keep Euro liquidity strong.The important thing then is to create an opportunity for this liquidity to get gainfully deployed in your economy. For this the government needs to revivie the investment cycle and boost foreign investor confidence. There are some indications that the governemtn wants to move in this direction, however given that they have spend four years going the other way it will still take some more time. The worst impact of the weak currency is that it increases inflation without an increased demand. We have already had two major depreciation cycles in the last three years. We clearly need the currency to stabilize if growth has to revive. However responses like reducing bank trading positons, increasing margins, making foreign borrowings easier are just short term fixes and that is what the government and regulators are doing right now.Interesting Chart formationsOver the last couple of years I have tracked the bonds and markets of Spain and Italy as two markets that have given lead indicators for other markets. Easing bond yields and reduction in fear in the bonds of these two countries has been positive for equity markets. Lately I have observed interesting chart patterns in the equity markets of both these countries. These mirror the way the markets were before the big bull phase started in the year 2004. Sometimes historical patterns do repeat as we saw in the case of gold. Lets see how it plays out for the equity markets.SPAIN IBEX WEEKLY CHART ITALY FTSE MIBMarketsWe are now at the beginning of the results season. Expectations are low and the the overall results season should be subdued and factored into the markets. The key is the economic growth outlook from here on. We have seen several brokerage downgrades over the last few weeks on India’s economic growth outlook. However it seems that they are turning pessimistic at the wrong time as they turned optimistic too early. The benefits of a normal and well spread out monsoon combined with strong government spending seem to be getting ignored. Even with a subdued investment cycle a 6% growth seems probable. Some sort of investment revival in the second half could also aid growth. However on the other hand, currency depreciation and its resultant impact on inflation wil reduce the pace of decline in interest rates and delay recovery. Overall it seems to be a mixed bag at this stage. The key will be to see where the INR stabilizes after the spiked sell off seen recently. Export oriented sectors like IT and Pharmaceuticals that are obvious beneficiaries of the currency move have remained strong whereas economy linked sectors have underperformed since the depreciation cycle started.Both Emerging Markets and EM currencies seem to be heavily oversold and due for a strong bounce back. However the drivers for a strong trend change seem to be missing at this stage. Maybe we will need to wait for 2014 for a bigger market move. Lets hope it happens earlier.

Monday, 8 July 2013

HCL TECH and Aurobindo Pharma – Two Interesting technical charts


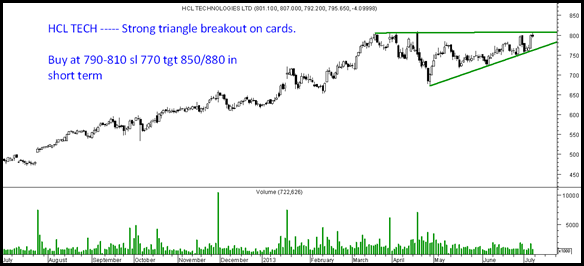
HCL TECH

A nice triangle formation with a breakout above 810-815 levels can give a strong move to 850/880 levels in the short term.
-> Can be a buy on dips or in momentum above 810-815 sustaining. Stoploss 770.


hcltech thumb HCL TECH and Aurobindo Pharma – Two Interesting technical charts

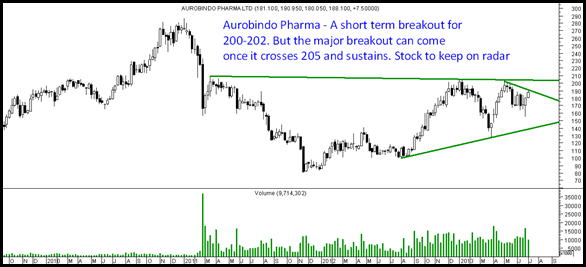
Aurobindo Pharma -


In the short term on daily charts a breakout above 190-191 gives a target of 200-202 but the major consideration should be done once it starts sustaining above 205
A stock to keep watch. below is a weekly chart.
AuroPharma thumb HCL TECH and Aurobindo Pharma – Two Interesting technical charts

How High US Yields can Go? DISASTER FOR EMERGING MATKET CURRENCIES

How High US Yields can Go?


US economy added 195K jobs in June. The news was good enough to spike up the Yields. The 10 Year Treasury yields now are at 2.72%.  It is trading at 2 year High. Technically, the breakout above 2.3-2.4% looks significant and seems to be the new base for the yields.

 
The Big question: Where should 10 Year US Treasury Yield be?
The 10-year yield typically trades between 0.8x and 1.0x times nominal U.S. GDP. If we assume that real growth is about 2.25% and inflation is at 1.40%, then we have nominal growth of 3.65%. At 0.8x (at low end of the range) — 0.8x 3.65% = 2.82%, not far from the current yield of 2.69%….Jim Cramer
Fundamentally, the market seems to have priced in and it would be interesting to see how market behaves from here on as far as bond prices are concerned. Remember, any more spike in Yields will be disastrous for Emerging market currencies and  may be equities too.

Trendless Market

 
Here’s the Chart of Nifty

 
There is very little one can do when market is just bouncing around with no clear direction. Just look at the chart of the Nifty – it’s just moving all over the place up down and nowhere. There is no clear leadership except few names in Pharma, IT and FMCG space.
Gas pricing reforms seem to have played out with Reliance making a big move but now at resistance of 890-910. ONGC will be in big subsidy mess thanks to INR depreciation. Banking looks weak with most of the stocks threatening to break down.
Nifty will open  down depending on Global cues but there is no fundamental strength in the market. With Tapering talk gathering momentum – Indian markets may not get adequate liquidity support too. So, there is very tough case to make in any direction right now. It’s a market that is avoid as of now on positional basis.
 

Thursday, 4 July 2013

BUY CESC ON WEEKLY CLOSE ABOVE 350

TECHNICAL VIEW ON CESC :

TECHNICALLY STOCK IS GIVING INVERTED HEAD & SHOULDERS BREAK OUT
 WEEKLY CLOSE ABOVE 350 CAN TAKE STOCK TO 450 IN NEXT 2 MONTHS


Its a month old chart , which I made on 7 june

will post fresh chart on  stock at weekend

Cesc Today hit 367 high

STATE OF GLOBAL FINANCIAL MARKET


                           STATE OF GLOBAL FINANCIAL MARKET
I would like to discuss about few points in this discussion
1. US EQUITY MARKET
2. TAPERING TALK
3. IMPACT ON US BOND MARKET
4. DAMAGE TO ASSETS ACROSS THE GLOB
5. WHY EMERGING MARKETS ARE IN MESS
6. WHATS GOING ON IN CHINA AND BRAZIL
DO YOU RECOGNIZE THIS PERSON?

HE IS MOST SECOND POWERFUL PERSON IN THE WORLD RIGHT NOW. JUST GUESS I WILL REVISIT THIS SOME TIME LATER


1. US EQUITY MARKET
Do u remember how this year started. We are now in the month of July and if we look at the year 2013 first half of the year is over and if we do a little rewind and go back and look at the issues that were confronting the market at the start of 2013. Do you remember there was a term “FISCAL CLIFF” and I am sure many of u may now had even forgotten about it and the amount of fear the fiscal cliff phrase was creating. The Fiscal cliff was the combination of tax increases and spending cuts which lot of people feared would push the US economy back to recession. But thankfully US government acted on time  and the combination of fiscal cliff and the supportive steps from the US Fed helped the US market and just have a look  at the SP 500 CHART

The period from sep – dec 2012 the SP was stalling at the level of 1460 but when the news came the Fiscal cliff was getting resolved in Jan 2013 the s&p made a big push and broke out above 1460 and if u see the first of 2013 it has been a nice up trending chart and every time small corrections came it took support at 50 DMA and its only in the month of June SP500 has broken the 50 day moving average and has sustained below it and till date it is  trading below 50 dma  which is kind of concern for the market and technical traders are saying that the S&P will fall to 200 day moving average of 1511.So even thought the first half of 2013 was great there is been a fear that things may not be that good for at least few more weeks or months. Generally the declines are fast and furious and may not be a prolonged one and what ever deeper correction the market want to go through will go through in very quick time. That’s the SP500 and if we want to come out with a fundamental based on charts
IN THE FIRST HALF OF 2013  S&P 500 POSTED 12.6% RETURN WHICH IS THE BEST SINCE 1998 DISPITE THE 1.5 % CORRECTION IN JUNE .QE WHICH HAS ACTING AS A HEAD WIND FOR THE MARKET NOW MAY BE ACTING AS A TAIL WIND 

2. WHAT IS THE TAPERING TALK

Before I talk that let me explain what is QE- QUANTITATIVE EASING
QUANTITATIVE EASY IS THE ANOTHER FORM OF MONEY PRINTING

QE was started by BAN BARNAKE at the peak of the financial crisis in 2008 and the idea was to print money and use that money to buy bonds from the banks and then give them cash. Now the banks will be flushed with cash because the bonds will be moved to fed and that cash can be used by banks to lend out an it will boost the economic activity and that’s how the economy can revive. US government did QE1, then QE2 and in Sept 2012 they started the QE 3.What is QE 3. Every month the fed will go out and buy 85 billion worth bonds in that 40 billion will be mortgage bonds and 45 billion will be treasury bonds so that much money will go to the banking system so it will kick start the economic activity. What happened was that on may 22 the US FED CHAIRMAN MR.  Ben Bernanke  in  a testimony before the congress said that economic growth is reviving so that the bond buying program can be eased off ( ex you are going on an highway and your are taking your foot from the accelerator not applying brakes) THAT IS CALLED TAPERING JUST EASING OF BOND BUYING PROGRAM.

4.WHAT IS THE PROBLEM?

WHEN QE 3 STARTED THERE WAS NO END DATE. It was a surprise for the market the QE 3 may end soon and another important thing for the market is it always looks for THE DIRECTION OF THE POLICY & SIGNAL TO THE MARKET. As now the market knows the QE program is going to stop it starts it will start pricing in the impact of that much in advance and as a result what happened was interest rates started to rise. QE means  banks will be flushed with cash so the cost of money will go down but if QE ends cost of money starts to move up and that get reflected in the rise of interest rates. The biggest impact was seen on the bond market 

10 years US TREASURY CHART


What  you see above is 10 year yield chart If you see the chart in OCT 2011  it was around 2.3 – 2.4 % it again peaked  in April 2012  to same level and then got sold off .Then just see in the month of June 2013 it broke out above that level right now interest rates are hovering around 2.5 % .Technically  there happened a large candle break out which means interest rates have reset to a new level and it’s for real. One of the strong points of US recovery is its housing market so the first thing that happened was the interest rates on mortgages started moving up. The trends have started and no one knows where its heading one thing is sure that the base rate will be 2.4% WHAT DOES THAT MEAN?
END OF BULL MARKET IN BONDS


WHILE UPDATING IT WAS 43 BILLION IN JUNE BUT AS PER LATEST REPORTS BY JUNE END IT WAS 80 BILLION
When interest rates raise price of bonds falls and yields go up which means the bull market that going on in bond market came to an end. June recorded the highest monthly outflows from the bond market about 80 billion in a single month that was the kind of panic that was in bond market in US

CURRENCIES

US BOND YIELDS SET THE BENCH MARK FOR THE COST OF MONEY AROUND THE WORLD
Europe sovereign yields
Emerging market Bonds
Emerging market currencies
Gold which yields nothing

You look at ITALY, SPAIN, PORTUGAL the 10 year yields in last 2 months have risen sharply which was hovering around 5 % and if they go above 6% they will not even able to service their debt. These countries will just break apart. That’s the problem with risen interest rates and that is why markets across the globe are so nervous

5. WHY EMERGING MARKETS ARE IN MESS
Chart of emerging market stocks


See the chart and you can see 2013 started on an optimistic hope and see how it has fallen and in last few weeks of June last it rallied but it definitely feels it’s in terrible bear market .Look at the SP 500 its up by 12% and emerging markets is down 10 %, you can see a out performance of S&P. There is a reason you look at all emerging markets like china, Brazil, India, turkey all are in terrible conditions

LETS TALK ABOUT EMERGING MARKETS

NOW REMEMBER AT THE BEGINNING OF THIS DISCUSSION I ASKED YOU TO GUESS ABOUT A PERSON. DO U KNOW WHOM HE IS The President of the People's Republic of China Xi Jinping
He is little bit of low profile till now but he has started asserting his leadership which is little bit different from previous one and he is giving a very serious message to the Chinese public and economy we are moving away from GDP obsession to more welfare and social and environmental indicators. Message is very clear that Chinese government is no more interested in stimulus reckless lending and credit expansion and move to slow and steady growth. The market pretty much captured that when there was recently the Chinese shybor shot up by 12 % .What puzzled many was the response of PEOPLE BANK OF CHINA which was very mute.
THE MESSAGE:
THE GOOD OLD RECKLESS CREDIT PRACTICES ARE COMING TO AN END. BANKS SHOULD PULL BACK ON LENDING. One global fund manager told the best way to play china is not to play at all

WHATS HAPPENING IN BRAZIL
CHART OF BRAZILAN INDEX
 

JUST SEE THE CHART ITS GOING ONE WAY DOWN AND THERE IS A HUGE PROTEST GOING IN BRAZIL which is making people more nervous   you will be surprised to know the trigger for the protest
 JUST 10 CENT HIKE IN BUS FARE
PROTESTORS DON'T WANT FIFA WORLD CUP, OLYMPICS  THEY WANT SUCH HUGE FUNDS TO USE FOR HOSPITALS BETTER WAY OF LIVING  THIS SOCIAL UNREST IS BECOMING A NEW PHENOMENA  WORLDWIDE


My idea was to go through the global markets in my next report I will be looking purely into the global financial markets. Hope you find this article useful. Thanks for your patience in reading this.